How to Generate a Sales Summary | Reports
Your month-end review is due. You need total sales across your estate broken down by machine, product, and payment method. The Sales Summary report gives you all of that - in one place, with nine ways to slice the data.
Prerequisites
The Sales Summary report aggregates your sales data across all machines under a selected operator and time period. Unlike the Dynamic Transactions Monitor, which shows individual transactions, the Sales Summary gives you rolled-up totals - perfect for performance reviews, operator reporting, and sharing with stakeholders.
Video Guide
00:00: Learn how to use the Sales Summary report to review total sales by machine, product,
00:04: and payment method in one place,
00:06: so you can analyze your data.
00:08: From the dashboard of your Nayax Classic Core platform,
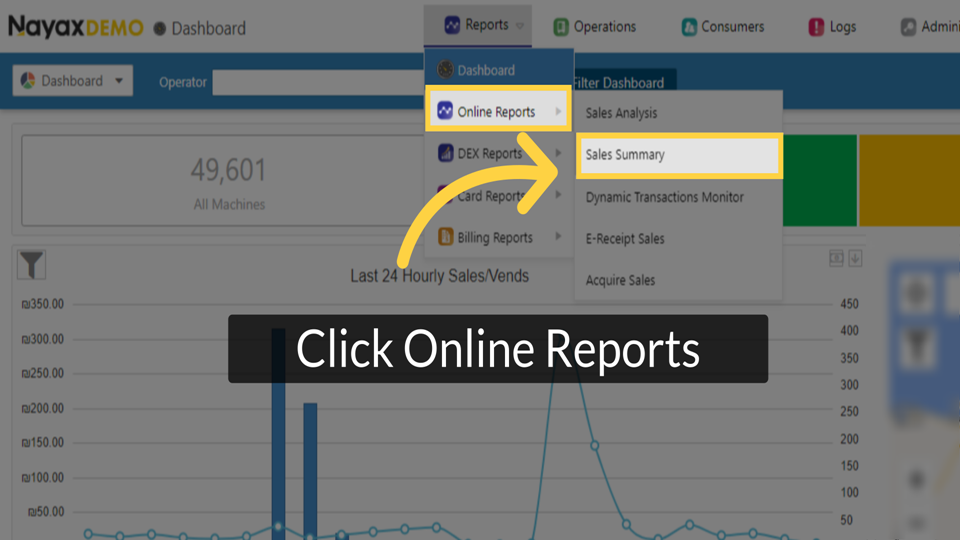
00:11: select the Reports tab. Next, click on Online Reports in the drop-down menu, and then
00:16: select "Sales Summary" from the sub-menu.
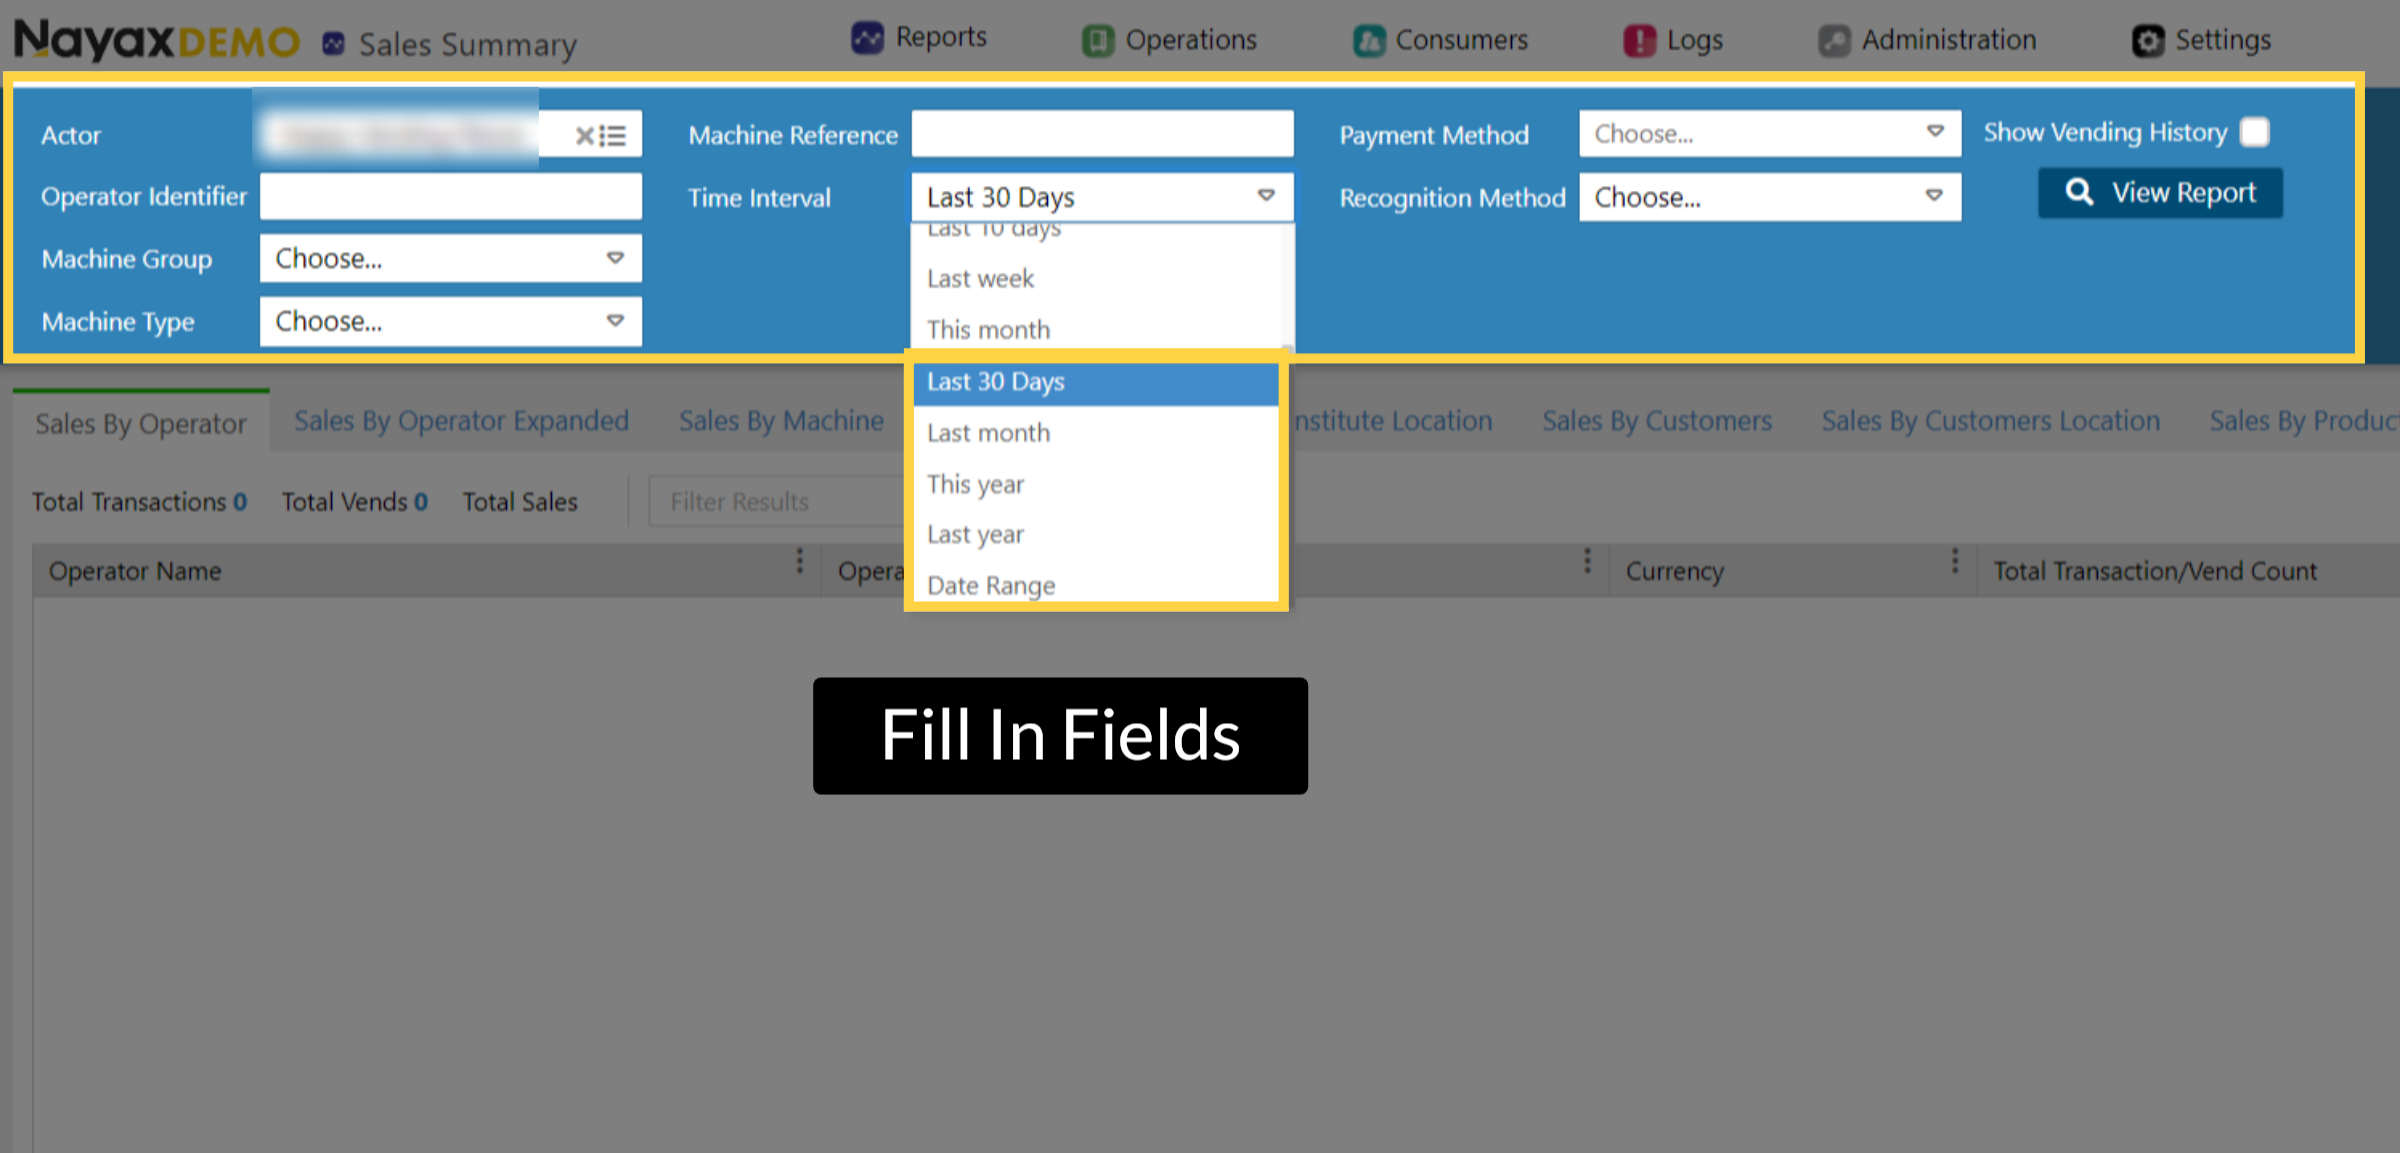
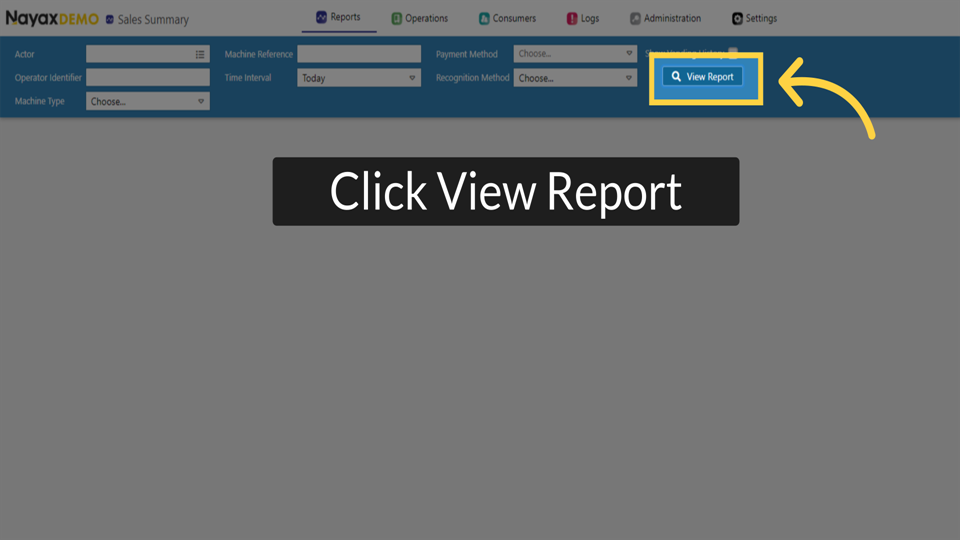
00:19: Set your filters. At a minimum, you need the Actor and Time Interval.
00:23: All other filters are optional and can be used to narrow the results
00:27: further. Click the 'Learn More' link to view a full explanation in Nayax U.
00:32: To find and create a tailored summary for each machine, use the Machine Type or
00:37: Machine Reference filters to narrow results to a specific machine or group.
00:42: The report page will open to the default 'Sales By Operator'
00:45: setting. To view the report for best-selling products, click on the tab Sales By
00:49: Product,
00:49: as highlighted. Click the 'Learn More' link to view a full explanation in Nayax U.
00:55: The results grid displays a summary row with totals: Total Transactions, Total Vends,
01:00: Total Sales, and payment method
01:01: breakdowns. Below, each row shows data for each active tab, including Currency,
01:06: Transaction Count, and Amount.
01:07: Click 'Learn More' for a full explanation in Nayax U.
01:12: Click Export to save the report.
01:13: Choose Excel for detailed analysis or PDF for sharing and support.
Sales Summary Report
Image Attached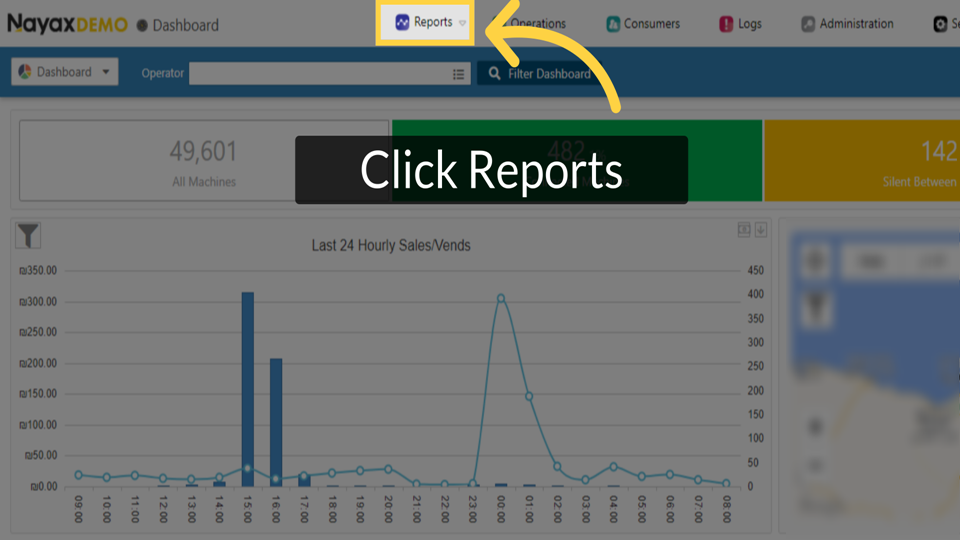
Fill in Operator Details
Image Attached| Filter | What it does |
|---|---|
| Actor Required | Enter the operator name or hierarchy. The report scopes to all machines under this actor. Distributors: enter the client operator name to generate their report. |
| Time Interval Required | Select the reporting period: Last 10 Days, Last week, This month, Last 30 Days, Last month, This year, Last year, or Date Range for custom dates. Default is Today. |
| Operator Identifier Optional | The operator's own internal reference number. Use to narrow to a specific operator ID within a hierarchy. |
| Machine Group Optional | Filter to a specific machine group if your estate is organised into groups. |
| Machine Type Optional | Filter to a specific machine type category. |
| Machine Reference Optional | Target a specific machine using its reference number. |
| Payment Method Optional | Filter by payment type (Credit Card, Prepaid, Cash, Monyx app, etc.) to see sales for one payment channel only. |
| Recognition Method Optional | Filter by how the payment was recognised at the machine. |
| Show Vending History Optional | Toggle on to include vending history data in the results. |
Pro Tip!
Image Attached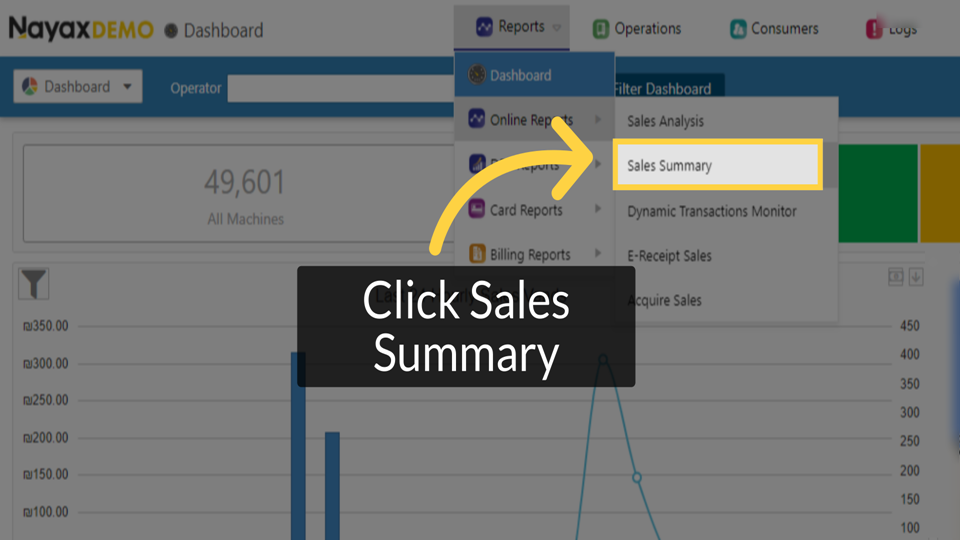
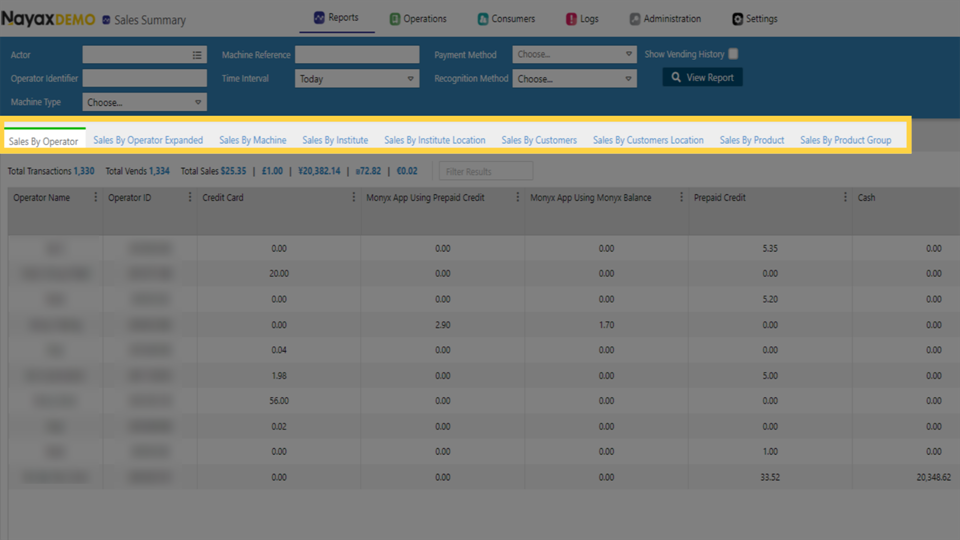
Switch Between Data View Tabs
Image AttachedOnce the report loads, nine tabs appear across the top of the results window. Each tab shows the same underlying data broken down differently.
No need to re-apply filters when switching tabs.
End-of-month review for a multi-site operator
Set Actor to your operator name, Time Interval to Last month, leave all optional filters blank. Click View Report. Switch to Sales By Machine to compare performance across all machines. Then switch to Sales By Product to see which products drove the most revenue that month. Both views use the same filter run - no need to re-apply.
Read the Report
Image AttachedThe results grid shows a summary row at the top with totals across the entire report scope: Total Transactions, Total Vends, Total Sales, and breakdowns by payment method, including Credit Card, Monyx App Using Prepaid Credit, Monyx App Using Monyx Balance, Prepaid Credit, and Cash.
Individual rows below the summary break down the same data per the active tab view. Each row also shows Currency, Transaction Count, and Transaction Amount in the rightmost columns.
Export Report
Image AttachedFormatted report with totals. Best for sharing with stakeholders or including in an operator review document.
Full data grid. Best for further analysis, filtering by column, or building into your own reporting workflow.
Thank you!
Did you find this article helpful?