How to Collect Logs for VPOS Media | Operations
Log collection and device logs are managed within Nayax Core, specifically located under the dedicated 'Dex' tab for each machine record. This process is key to quickly identifying the root cause of operational disruption.
Video Guide: How to Collect Logs for VPOS Media | Operations
00:00: Log collection is a key step in quickly identifying and resolving device issues.
00:04: Learn how to collect device logs in Nayax Core using the dedicated Dex tab.
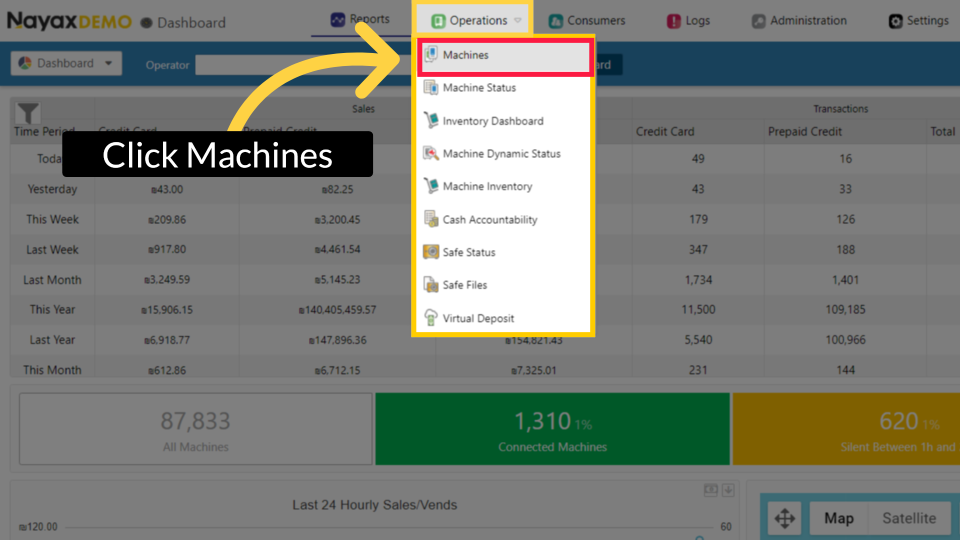
00:10: On the dashboard of your Nayax Core platform, click the Operations Tab, then, from the
00:14: drop-down menu, click Machines, as highlighted.
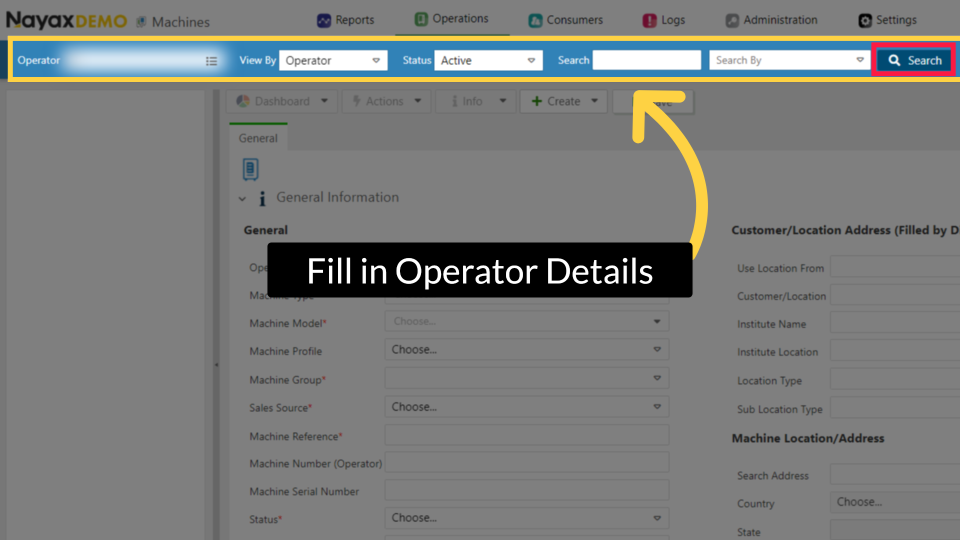
00:17: Type the Operator's name and any other fields to locate the machine, then click
00:19: Search.
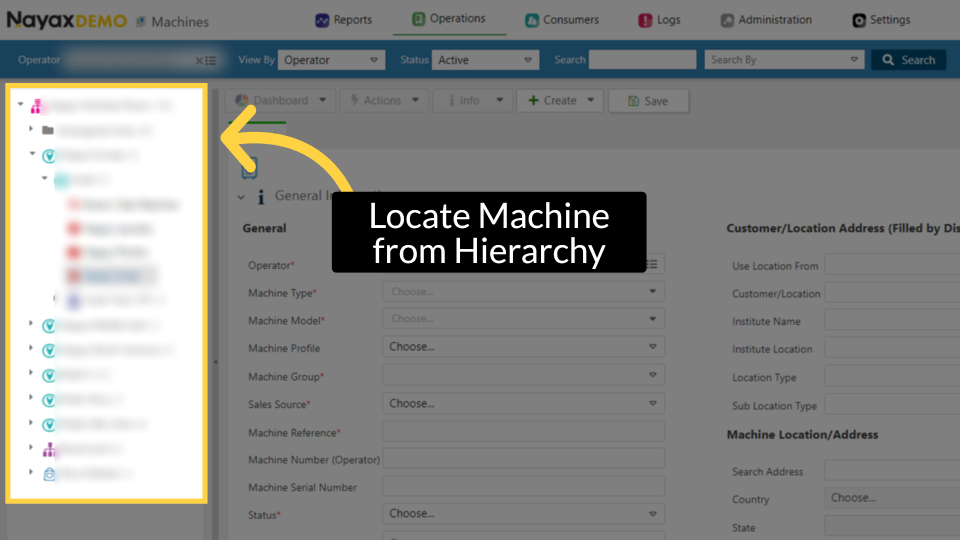
00:23: Locate and click on the machine from the hierarchy.
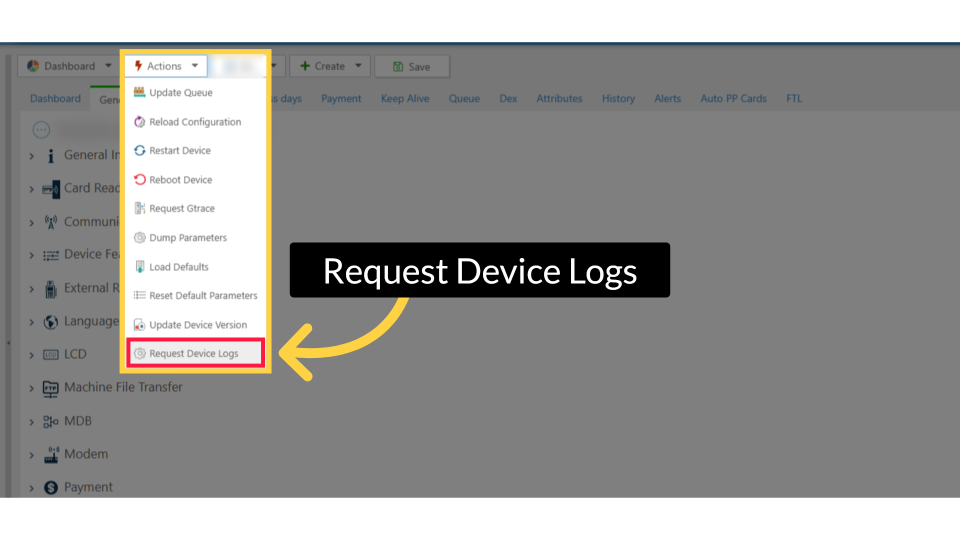
00:26: Click Actions and then select Request Device Logs from the drop-down menu.
00:31: The Device Logs window opens, where you can select Last 3 Days to retrieve logs
00:35: from the past 72 hours, or choose Custom Range to define a specific time period.
00:41: To set a specific start date and time,
00:43: click on the calendar icon.
00:44: Once preferences are set, click Request Logs to submit the request.
00:49: A green confirmation message confirms that the log request was successfully sent to
00:53: the queue.
00:55: Click on the Queue Tab in the top menu, and you will see the DEX request displayed
00:59: in the Queue.
00:59: This may take several minutes.
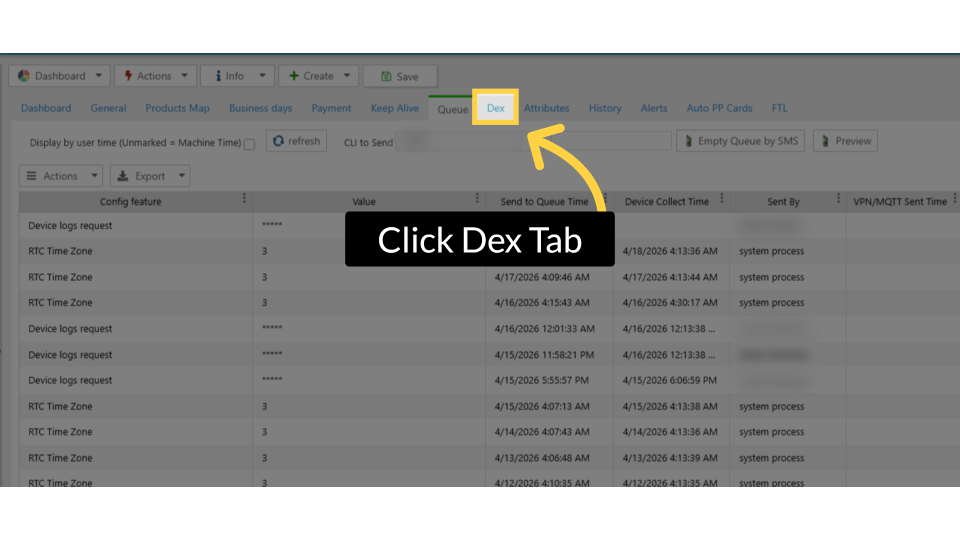
01:02: Click on the Dex from the top tab menu.
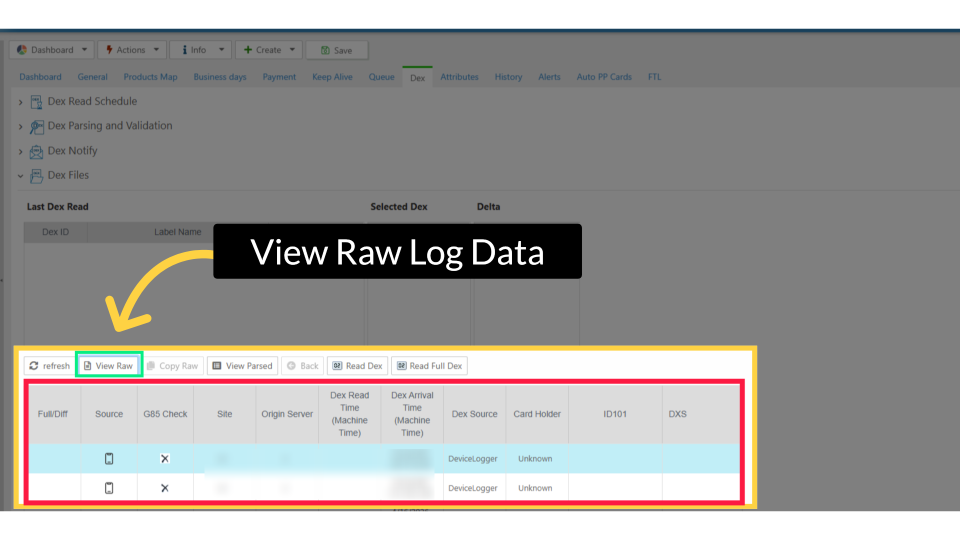
01:05: Scroll down, click the Dex Log in the table, then click "View Raw" to access the raw
01:09: log data for a detailed view.
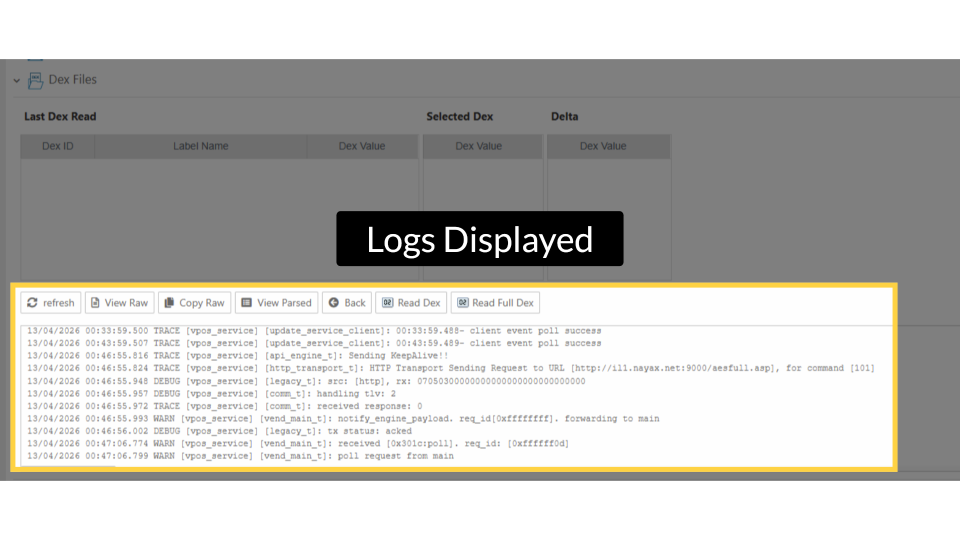
01:11: The detailed log of device events will be displayed. These logs can now be reviewed
01:16: to identify and resolve device issues.
Click Machines
Image AttachedOn the dashboard of your Nayax Core platform, click the Operations Tab, then, from the drop-down menu, click Machines, as highlighted.
Fill in Operator Details
Image AttachedType the Operator's name and any other fields to locate the machine, then click Search.
Locate Machine from Hierarchy
Image AttachedLocate and click on the machine from the hierarchy.
Request Device Logs
Image AttachedClick Actions and then select Request Device Logs from the drop-down menu.
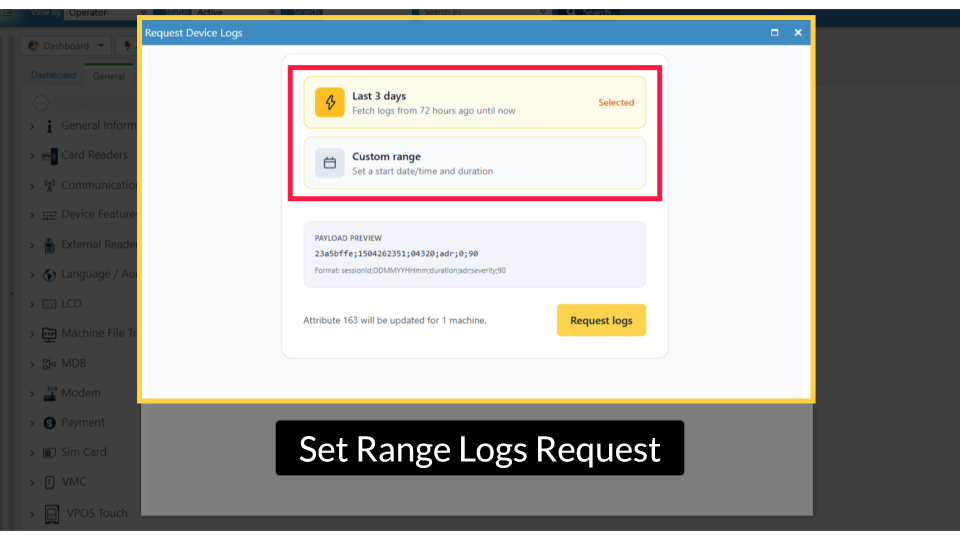
Set Range Logs Request
Image AttachedThe Device Logs window opens, where you can select Last 3 Days to retrieve logs from the past 72 hours, or choose Custom Range to define a specific time period.
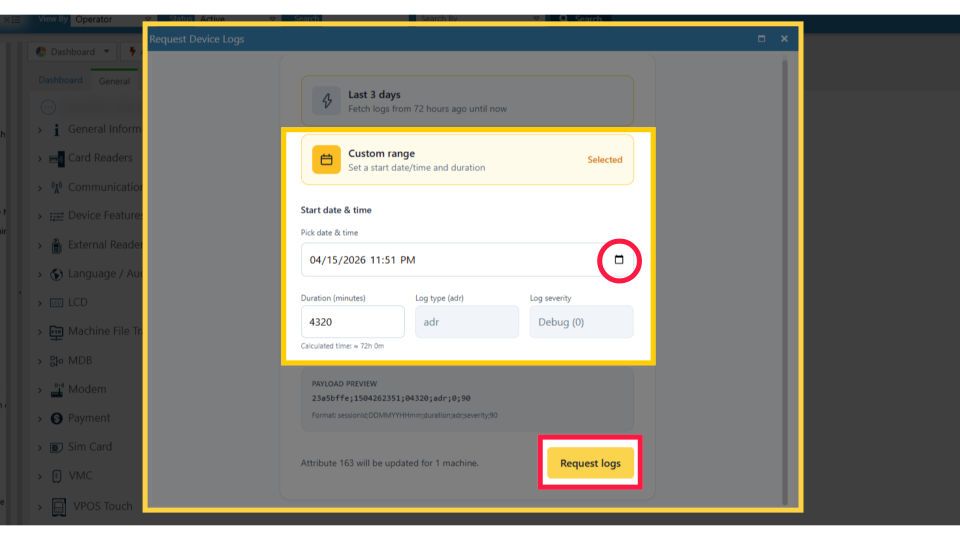
Custom Logs Range
Image AttachedTo set a specific start date and time, click on the calendar icon. Once preferences are set, click Request Logs to submit the request.
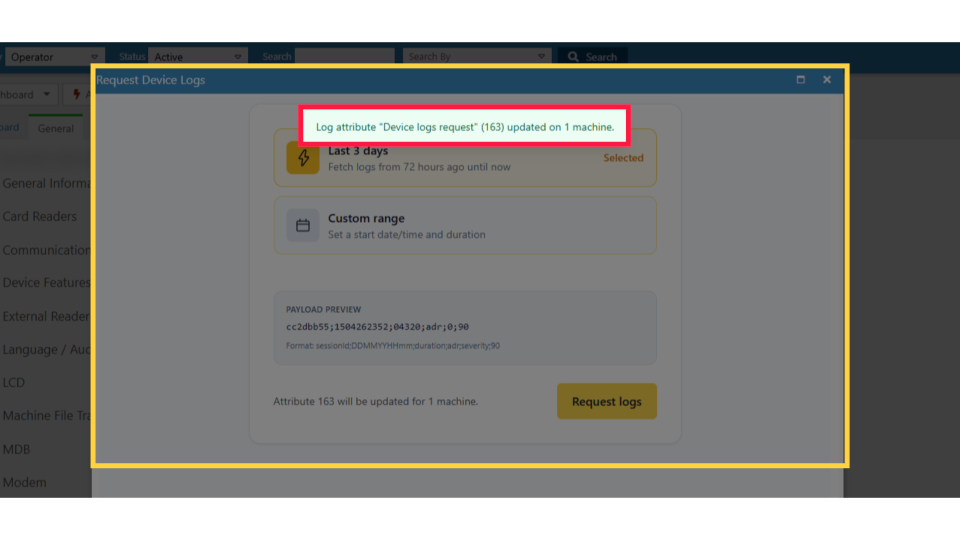
Confirm Log Time Selection
Image AttachedA green confirmation message confirms that the log request was successfully sent to the queue.
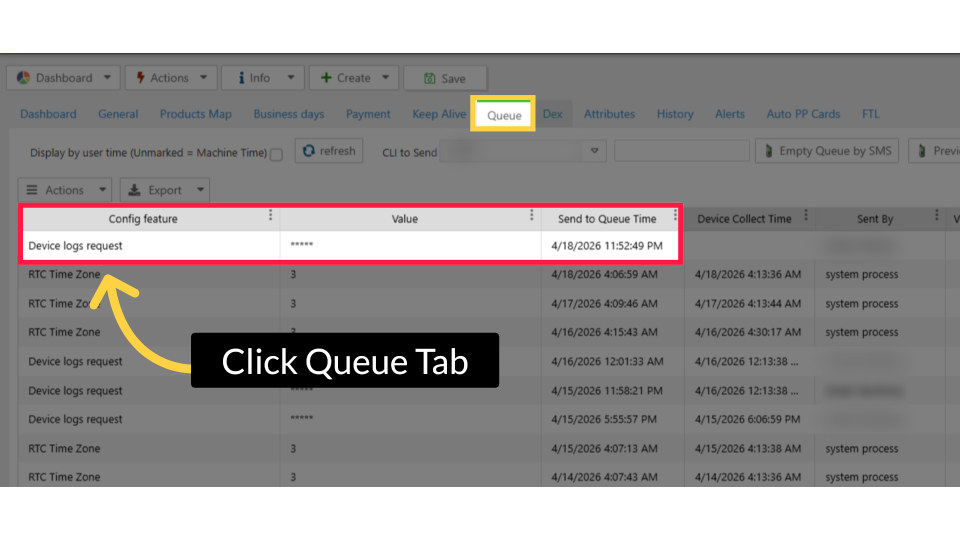
Click Queue Tab
Image AttachedClick on the Queue Tab in the top menu, and you will see the DEX request displayed in the Queue. This may take several minutes.
Click Dex Tab
Image AttachedClick on the Dex from the top tab menu.
View Raw Log Data
Image AttachedScroll down, click the Dex Log in the table, then click "View Raw" to access the raw log data for a detailed view.
Logs Displayed
Image AttachedThe detailed log of device events will be displayed. These logs can now be reviewed to identify and resolve device issues.
Thank you!
Did you find this article helpful?