🎛️ Dashboard Overview | Retail Core
After logging into Nayax Retail Core, the dashboard is displayed on the home page which presents daily, weekly, monthly, or yearly statistics of your company. The topics displayed can be adjusted to present a time span and item count of your choice.
Video Guide
Dashboard Homepage
Image Attached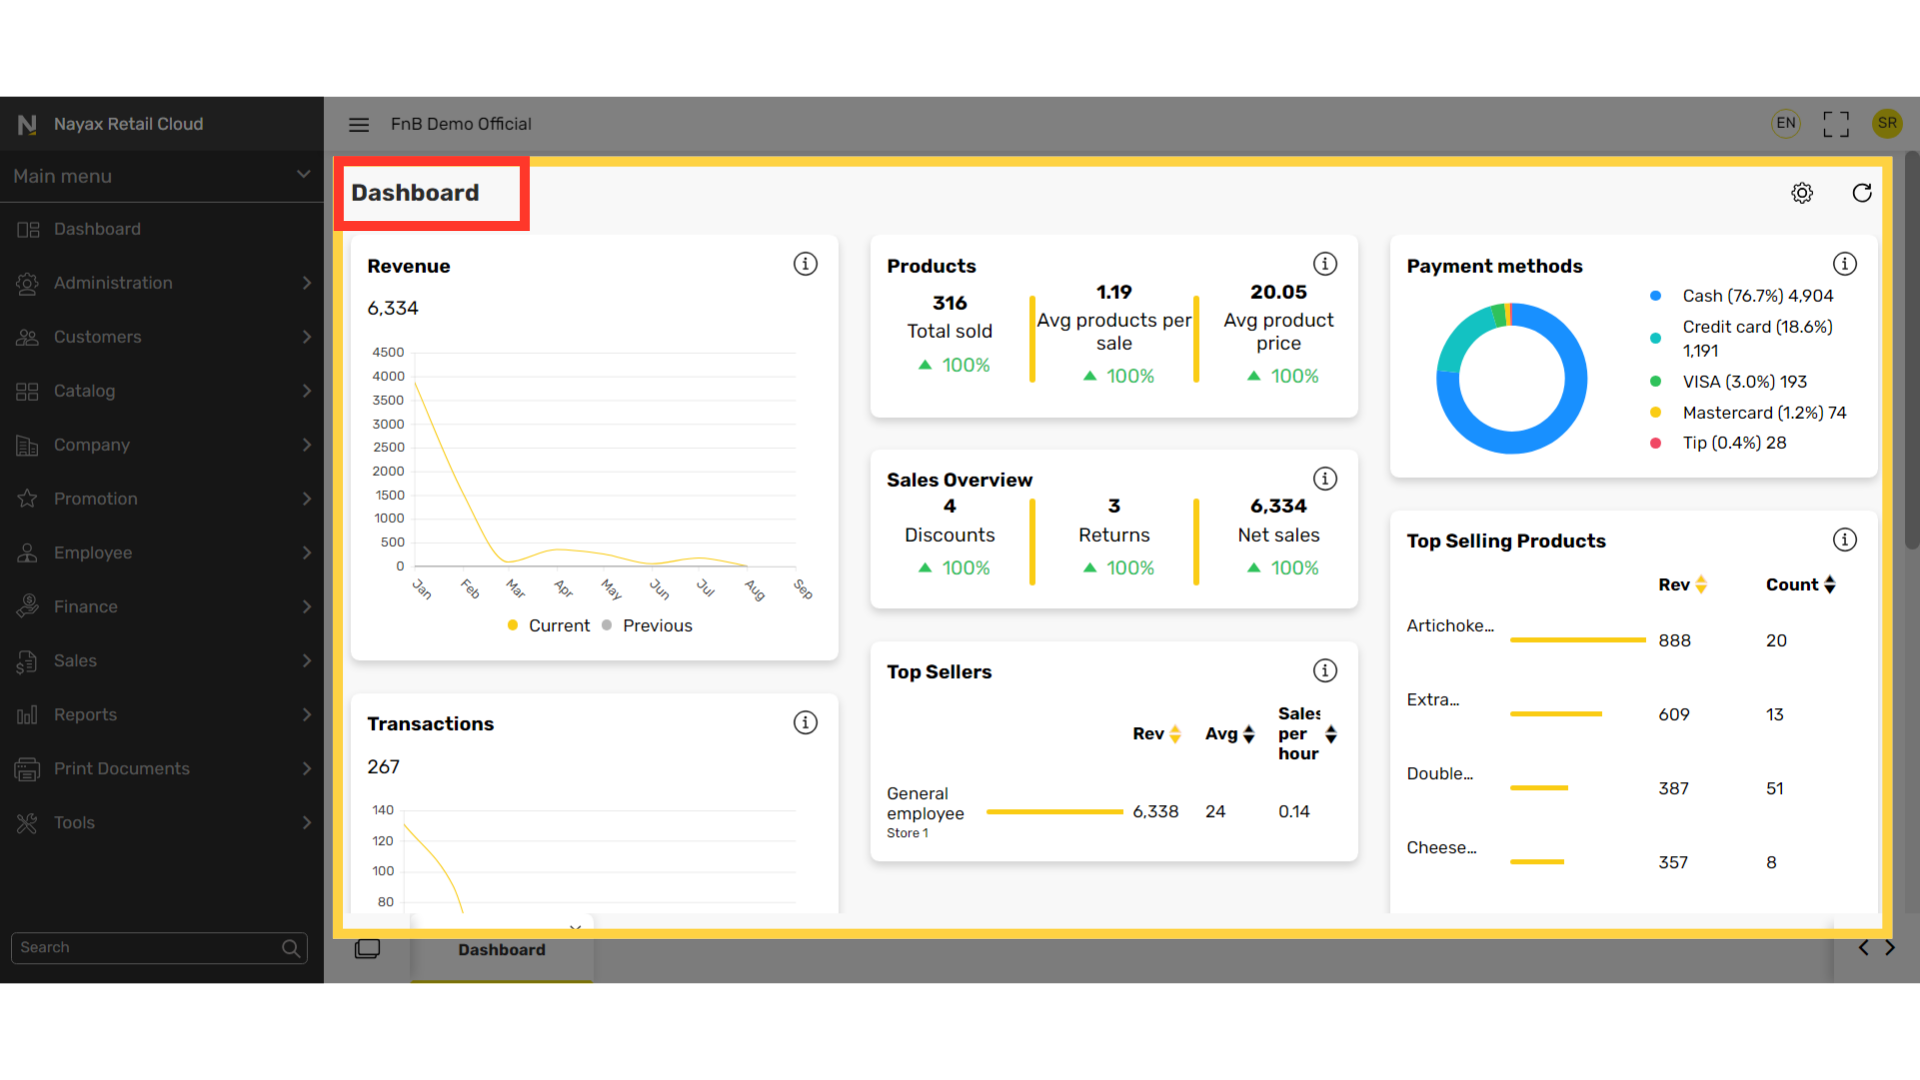
Key information is shown on the dashboard:
Image Attached|
Revenue |
The revenue within the selected time span. |
|
Transactions |
The number of transactions made. |
|
Avg. Transaction |
The average monetary amount of a transaction. |
|
Products |
|
|
Sales Overview |
The overview of all sales made within a selected time span. |
|
Top Sellers |
Top salespersons |
|
Payment Methods |
Top payment methods used to make purchases |
|
Top Selling Products |
Your top selling products
|

You have administrative access to all companies and stores in the dashboard settings
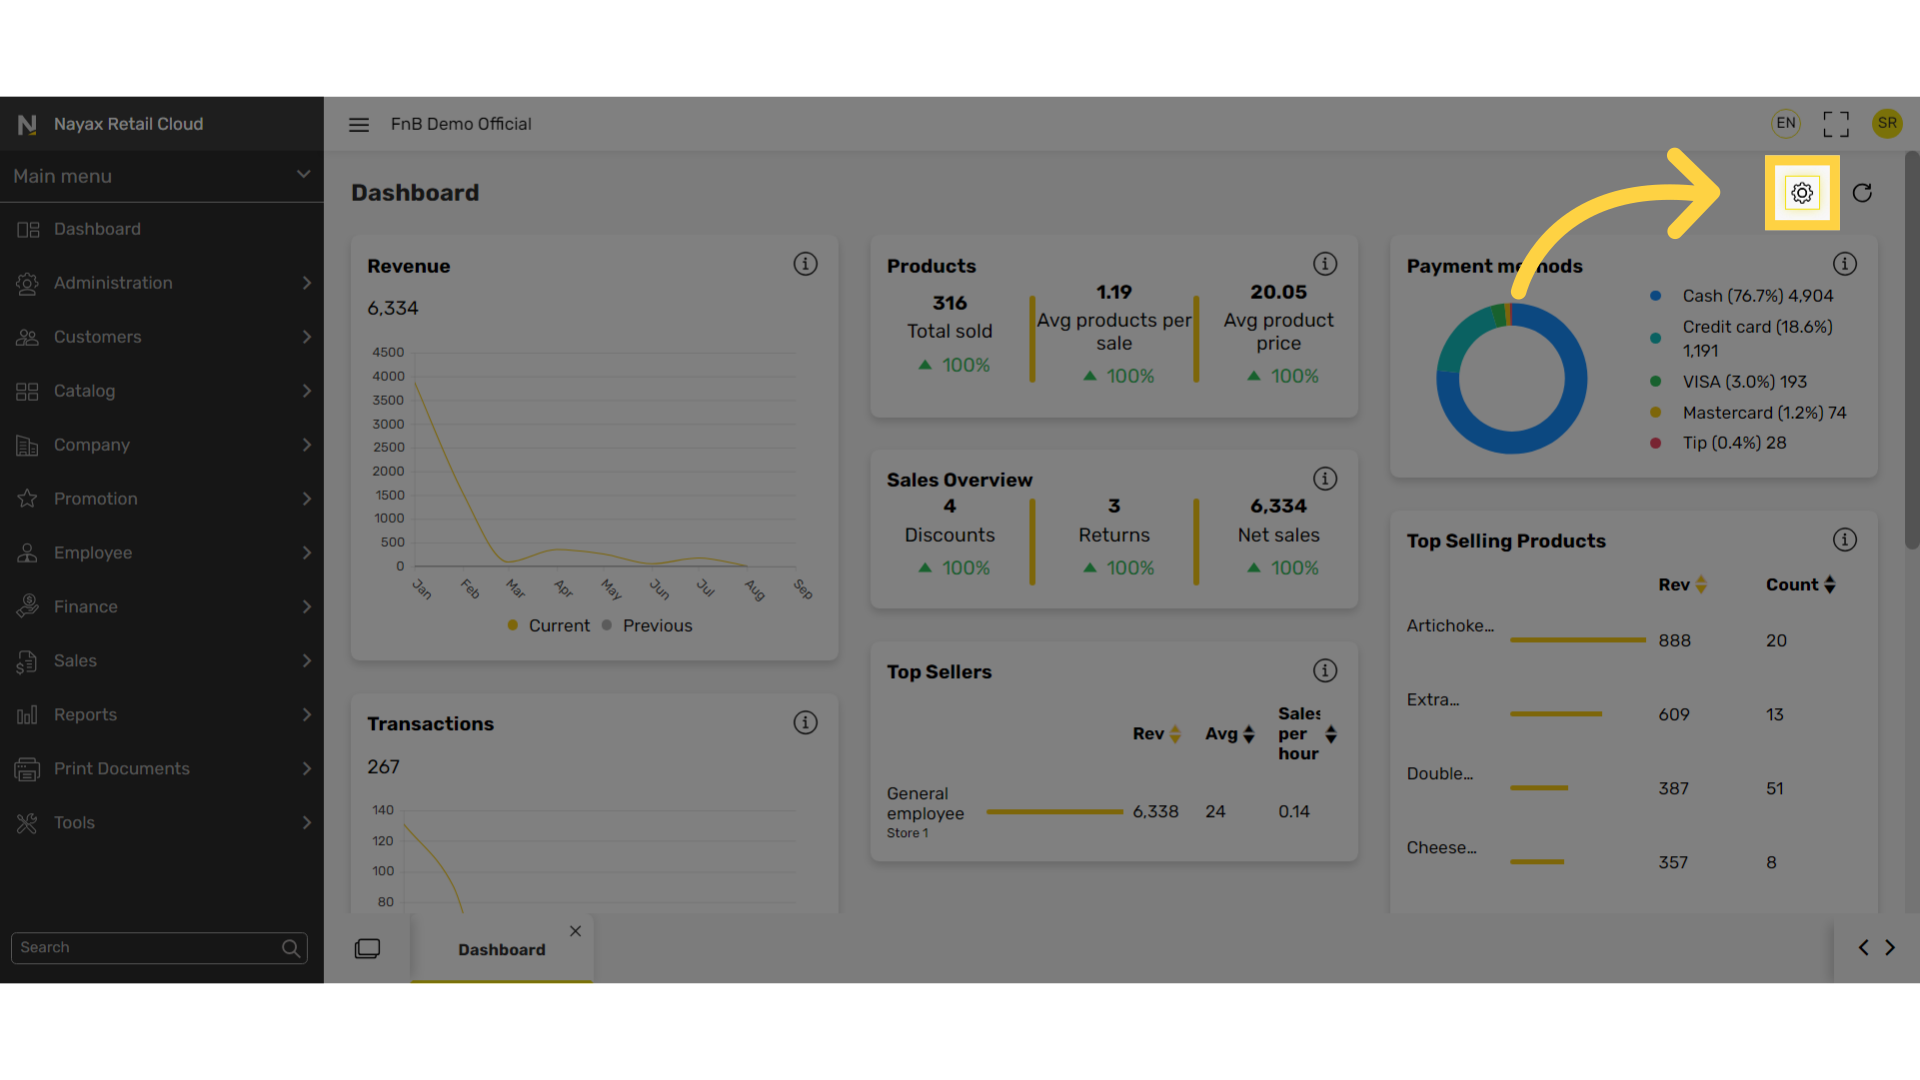
Image AttachedClick on the settings icon on the top right corner of the screen.
Select a time span from the drop down window.
Image Attached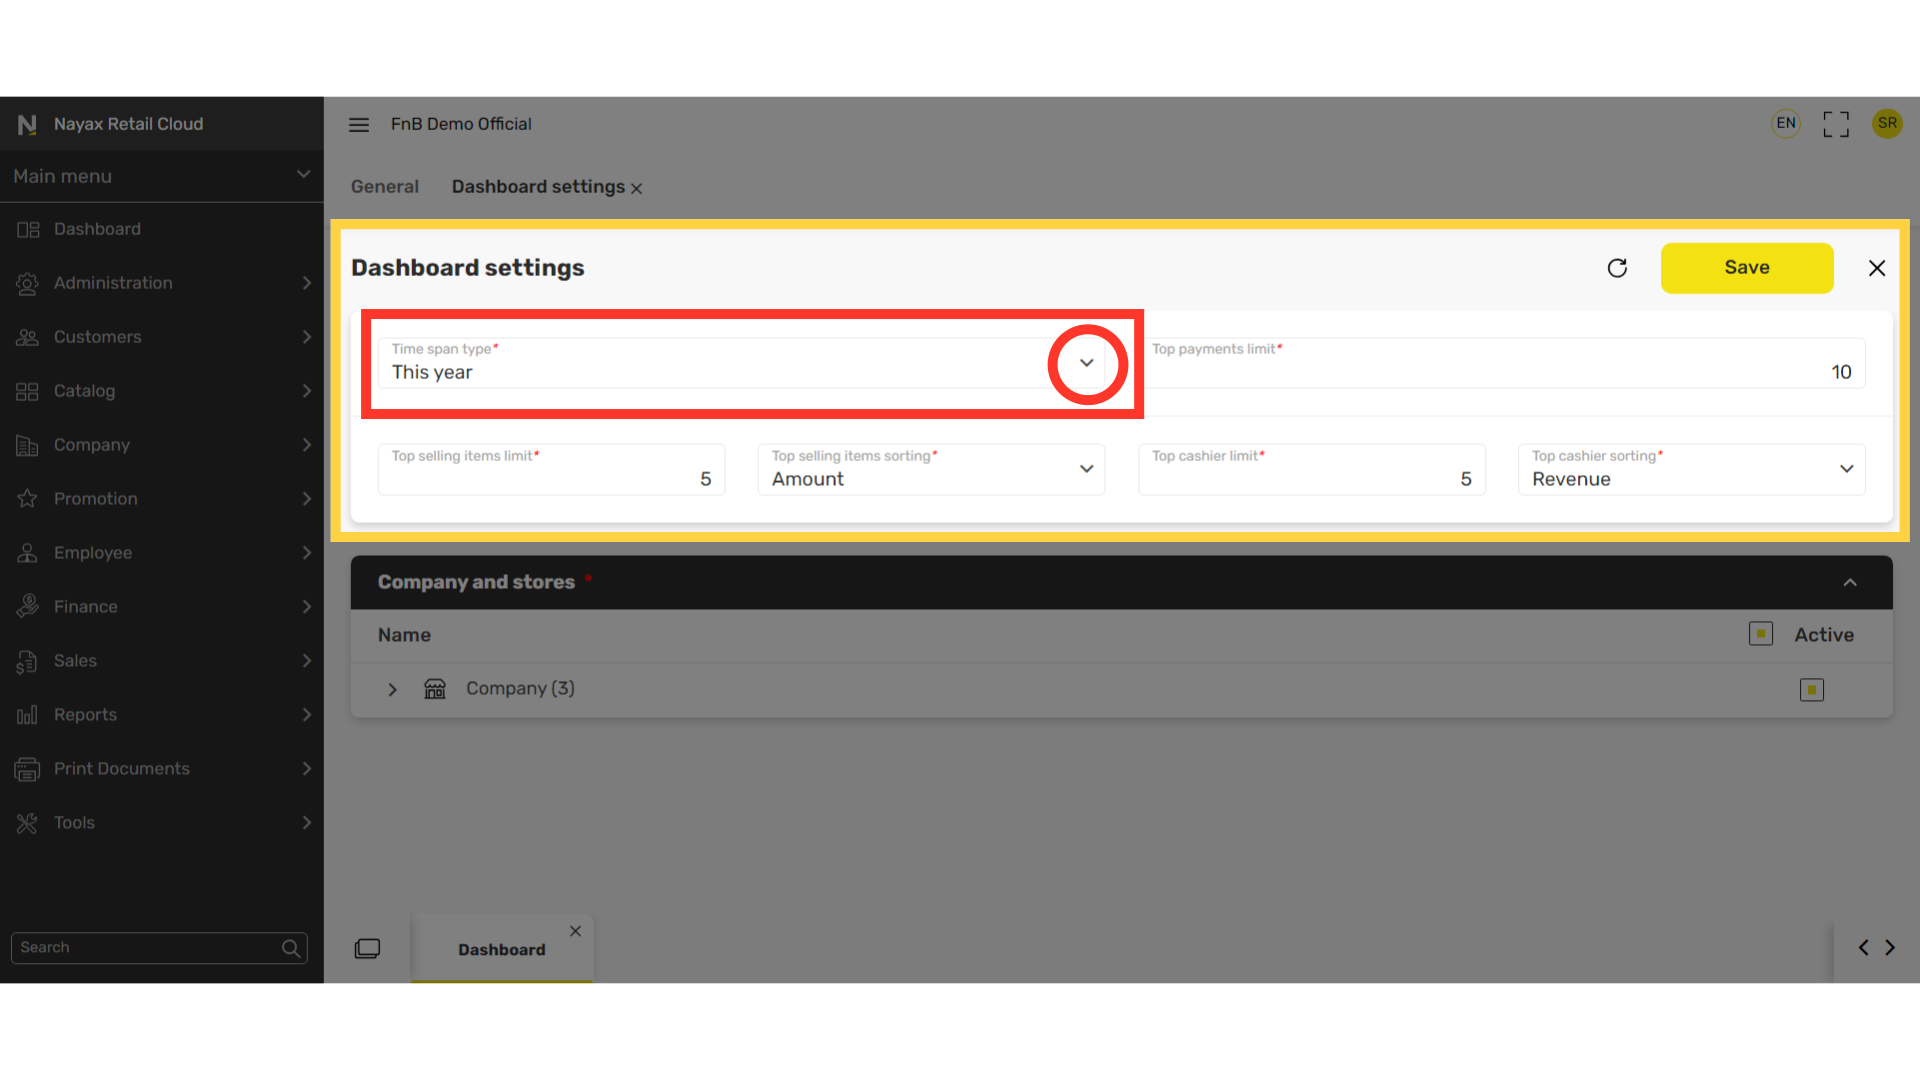
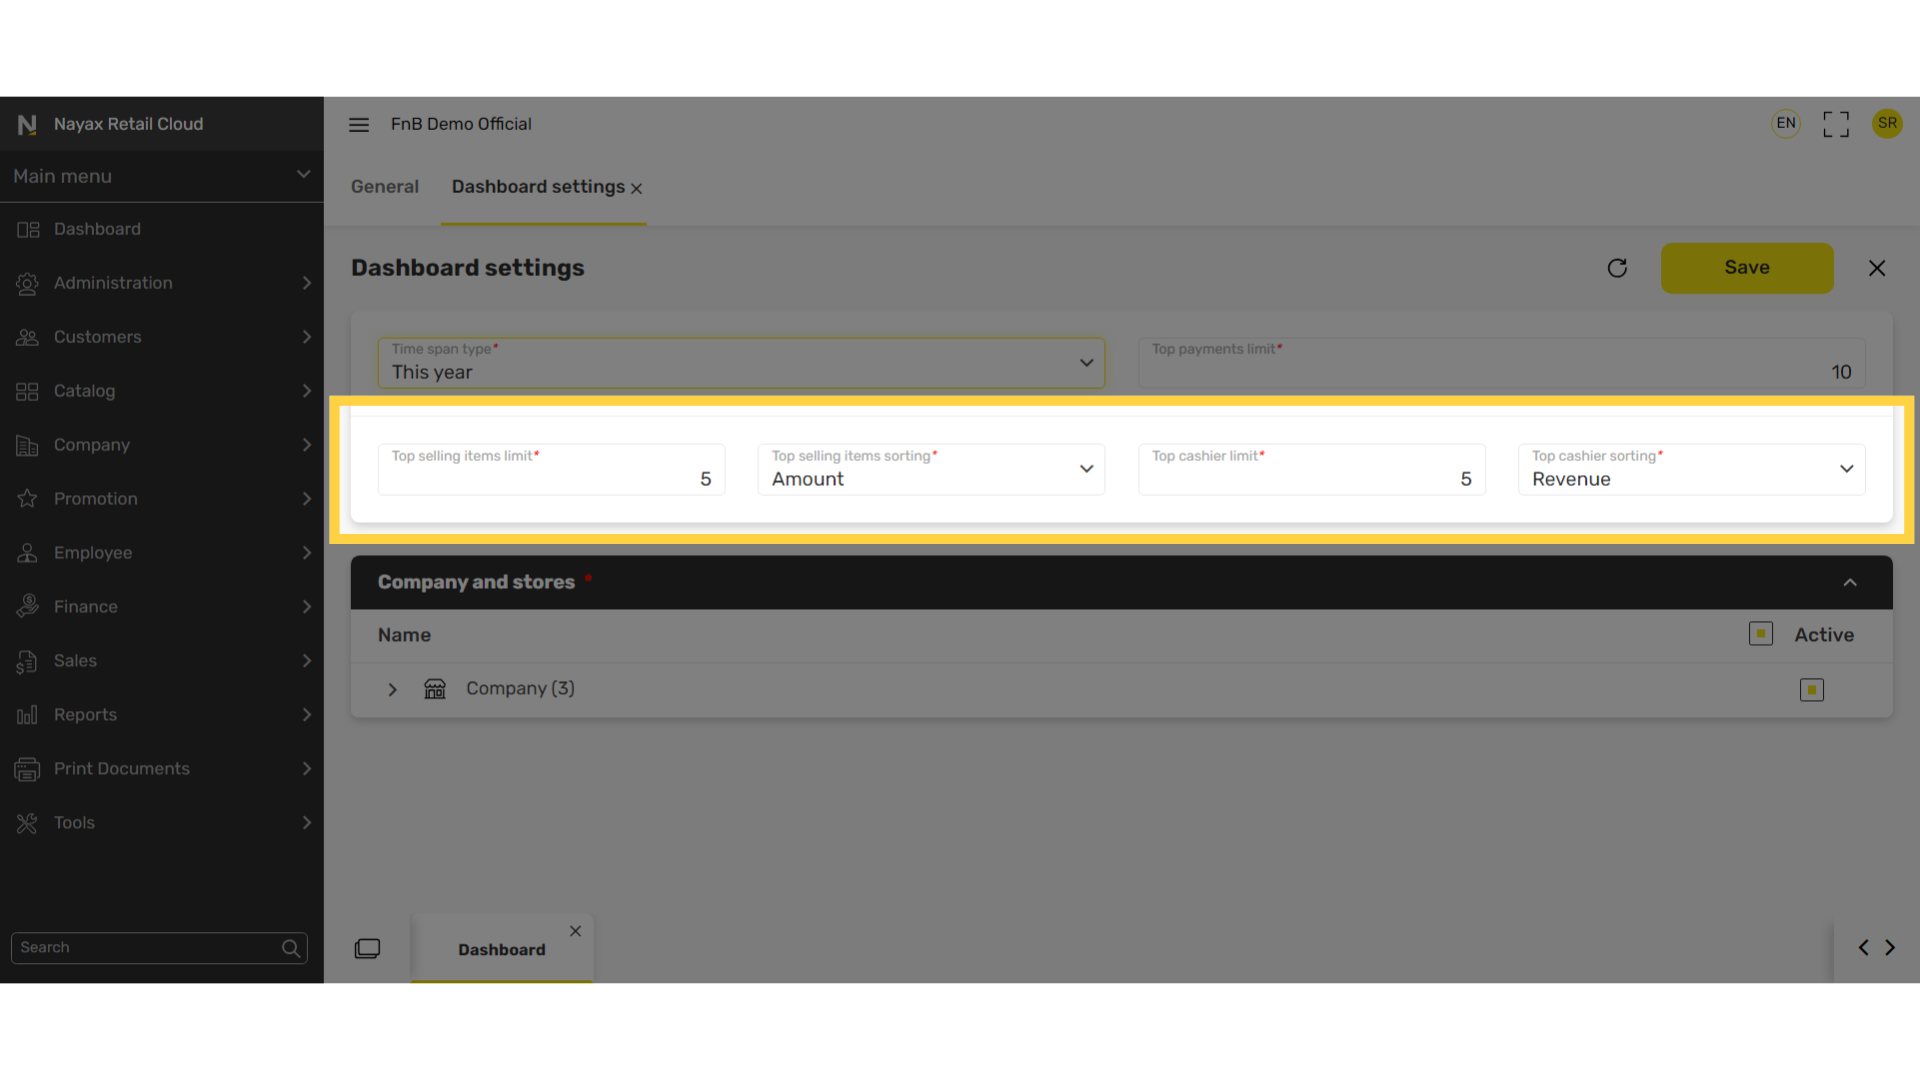
Fill in the following fields: Some defaults have already been set
Image Attached|
Top payments limit |
The amount of payment types taken into account when calculating the statistics. ie. Cash, Visa, Amex, ect. |
|
Top selling items limit |
The number of top selling items you want displayed. |
|
Top selling items sorting |
The way in which the top selling items are determined: by monetary amount or quantity sold. |
|
Top cashier limit |
The number of top cashier personnel. |
|
Top cashier sorting |
The way in which the top cashier personnel is determined (Ex. most revenue, top average usage, or productivity.) |
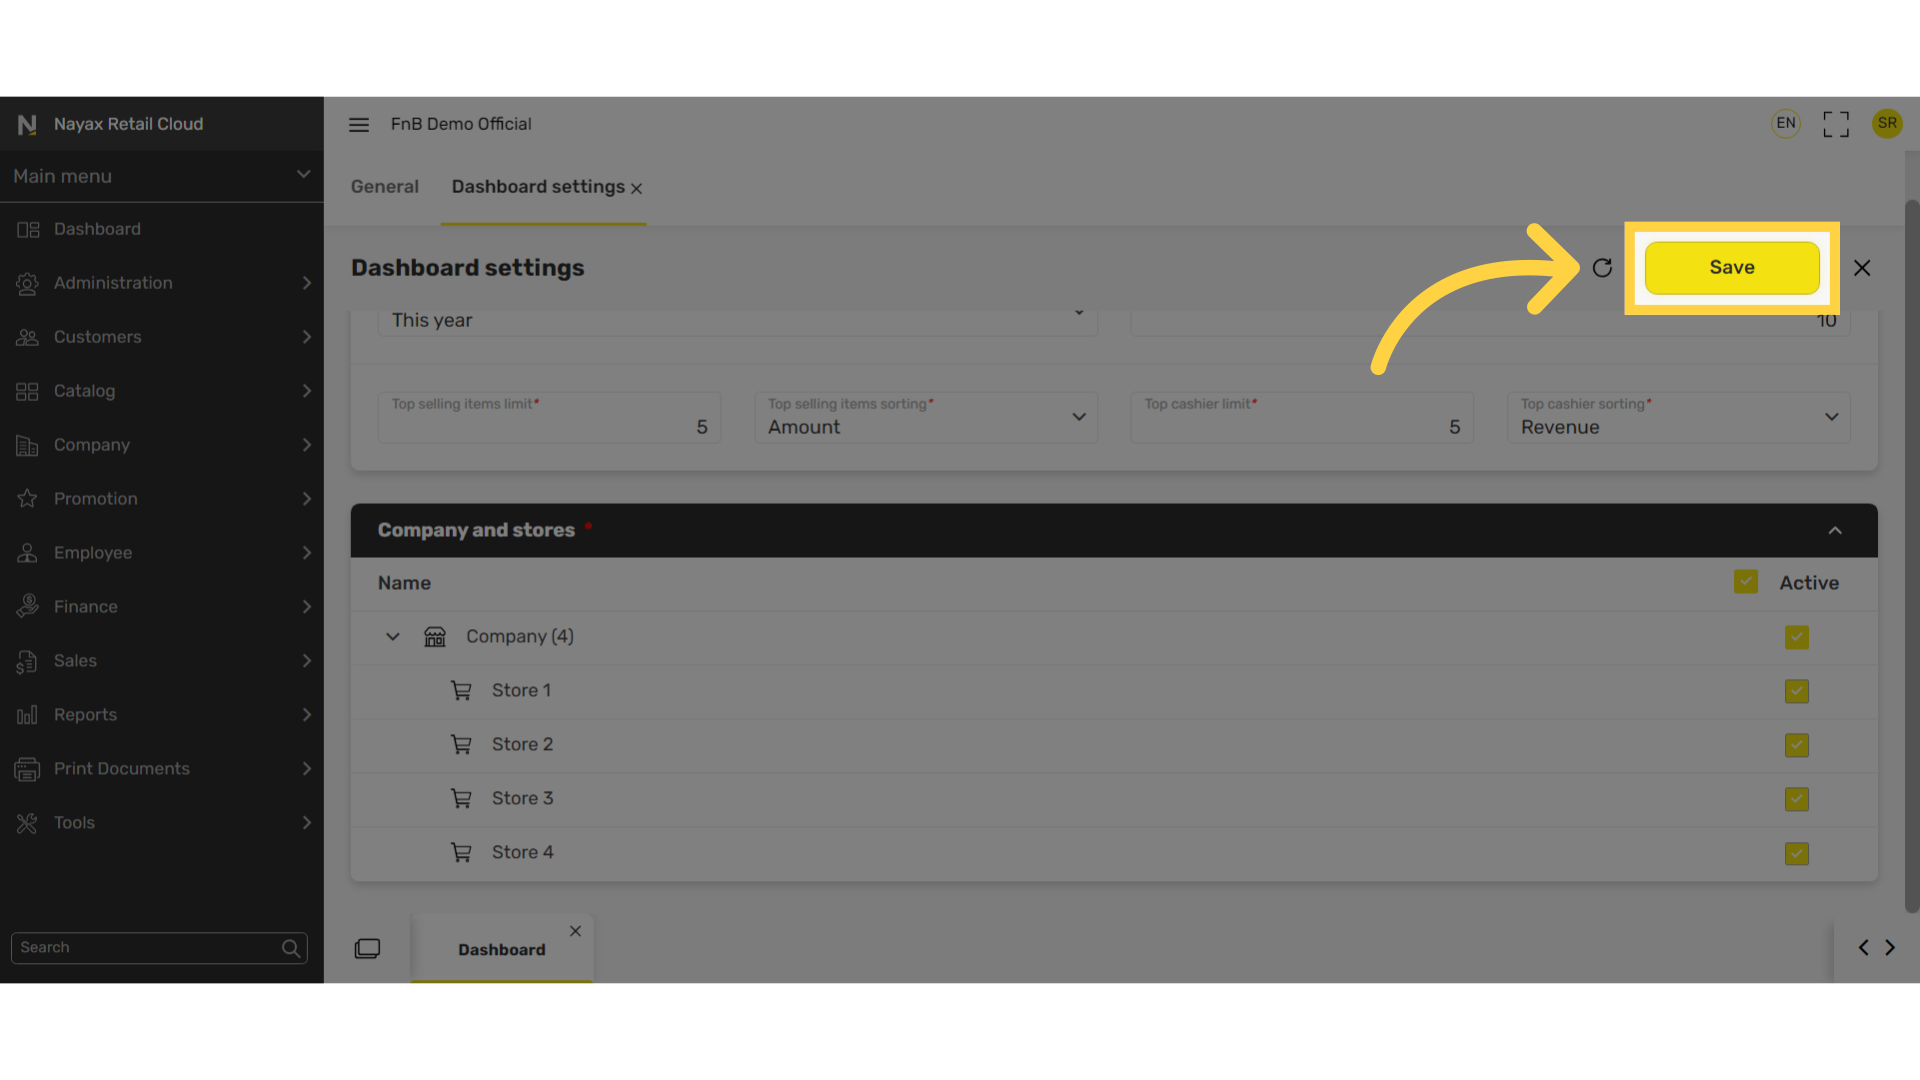
Click Save
Image AttachedClick Save.
Thank you!
Did you find this article helpful?