00:00: Learn how to efficiently view the best-selling products in your machine in Nayax Core.
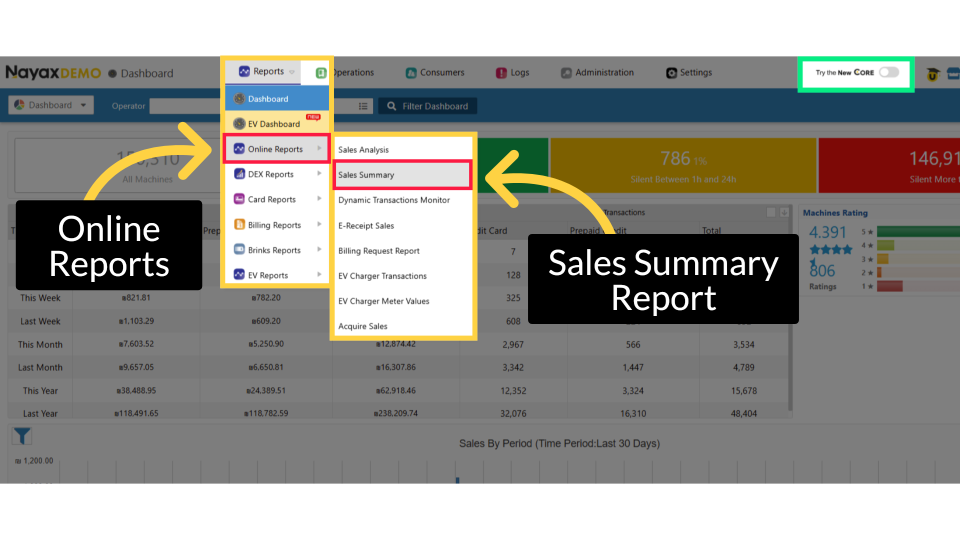
00:05: From the dashboard of your Nayax Classic Core platform,
00:07: select the Reports tab. Next, click on Online Reports in the drop-down menu, and then
00:13: select "Sales Summary" from the sub-menu.
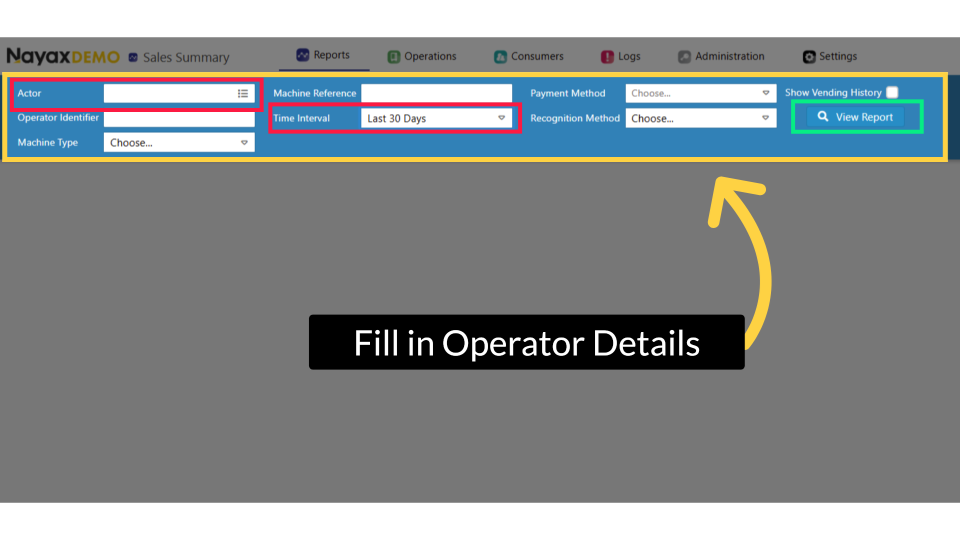
00:15: Enter the operator details and any additional information in the search fields.
00:20: Filter your search by entering values in any other fields to refine your results.
00:24: Don't forget to select the time interval for this report.
00:28: We recommend generating this report based on the last 30 days.
00:31: Click the View Report button to generate the report as highlighted.
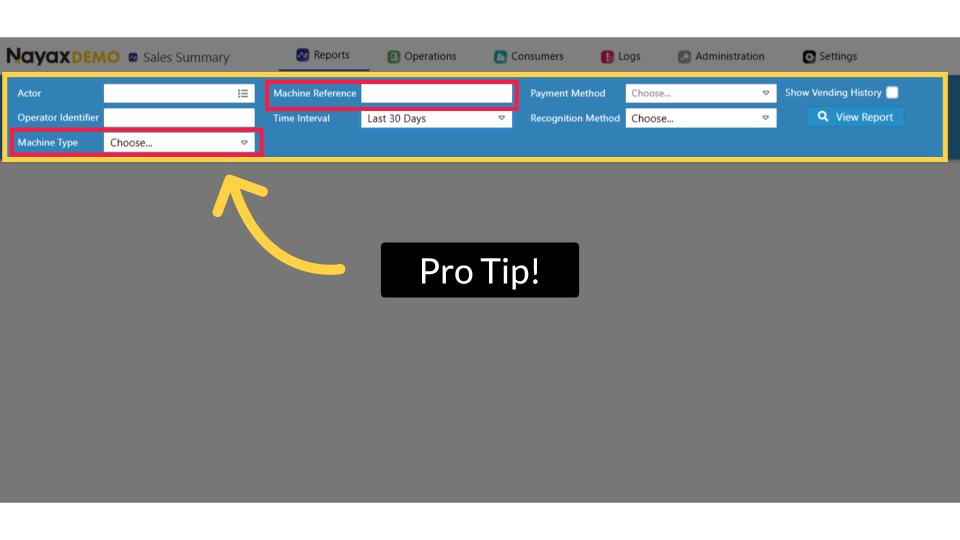
00:36: To find the best-selling product for each machine,
00:38: use the Machine Type or Machine Reference filters to narrow results to a specific
00:43: machine or group.
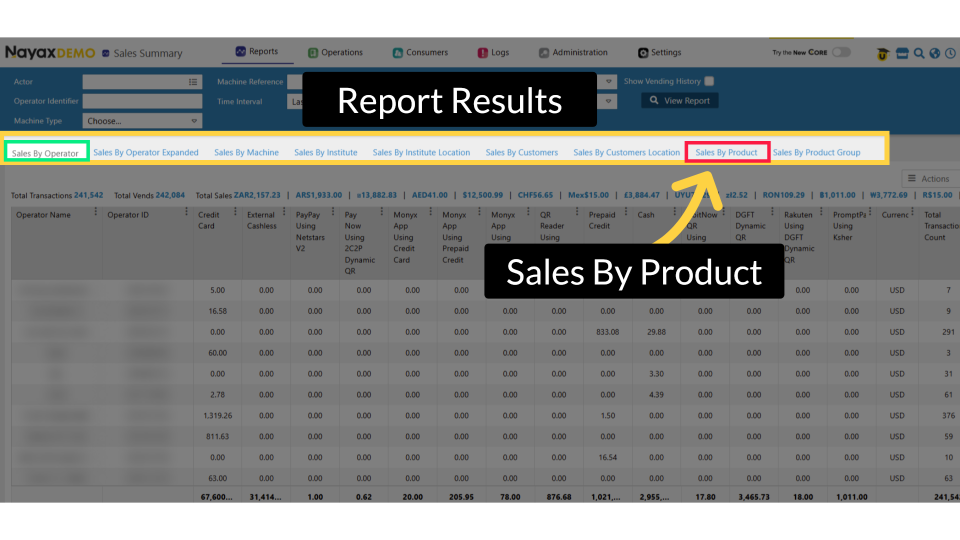
00:45: The report page will open to the default 'Sales By Operator'
00:48: setting. To view the report for best-selling products, click on the tab Sales By
00:52: Product, as highlighted.
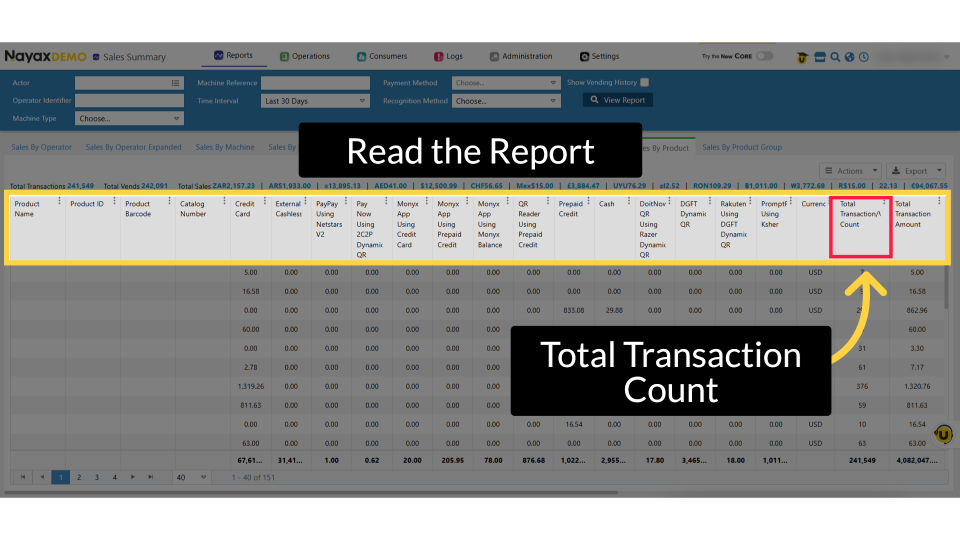
00:54: The Sales by Product tab shows one row per product. The column Total Transaction
00:59: Count shows the number of times each product was sold during the selected period.
01:02: Click Total Transaction Count to sort by this column's highest count, and click
01:07: Learn More to view a full explanation on Nayax U.
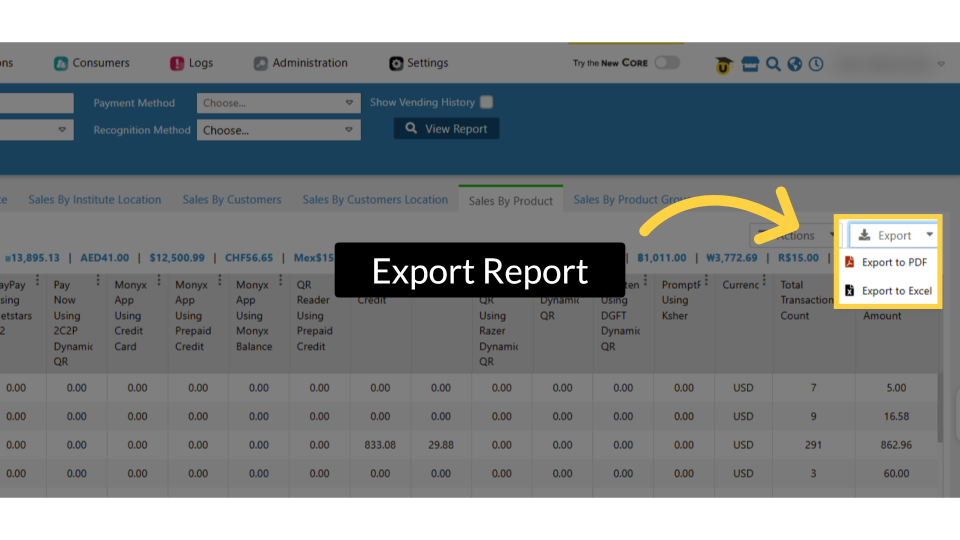
01:11: Click Export to save the report.
01:12: Choose Excel for detailed analysis or PDF for sharing and support.